
Company Overview & Industry Context
NextEra Energy (NEE) operates a dual-platform model that blends Florida Power & Light (FPL)—the largest regulated electric utility in Florida, serving over six million customer accounts—with NextEra Energy Resources (NEER), the world’s largest generator of wind and solar power and a leader in battery storage. As of year-end 2024, NEE oversaw ~72 GW of net generation and storage capacity across natural gas, wind, solar, nuclear, and batteries. The company’s 2024 generation mix was diversified: natural gas ~40%, wind ~35%, solar ~17%, nuclear ~7%, and oil/other <1%, with ~1.2 GW of battery storage integrated for balancing.
On reported figures, 2024 revenue was $24.8 billion (down from $28.1 billion in 2023). Operating profit was $7.5 billion (down vs. $10.5 billion in 2023). Cash generation remained strong (CFO ≈$13.3 billion) and liquidity ample (~$18 billion available, including ~ $1.5 billion cash). The balance sheet reflects growth investment (PP&E to ~ $139 billion) alongside investment-grade access to capital. Management’s 2024 MD&A centers on disciplined execution of a $74.6 billion capital plan over 2025–2029—roughly two-thirds in regulated FPL and one-third in NEER renewables.
Sector context remains constructive for multi-year capex: grid hardening, load growth (including data centers/AI), and decarbonization have many utilities guiding for elevated investment. The Inflation Reduction Act sustains 30% ITC/PTC incentives (with adders) for wind/solar/storage and supports tax-credit monetization via transferability. Against this backdrop, NEE’s scale in renewables and regulated utility stability provide visible cash flows but also expose valuation to interest-rate moves and policy/regulatory timing.
Audit and control signals are clean: Deloitte issued unqualified opinions on the financials and ICFR, with CAMs focused on Level 3 derivatives and regulatory accounting judgment. No restatements or material weaknesses were reported.
Strategic Focus (2–4 Levers)
1) Regulated Growth at FPL. FPL remains the anchor of stability, with customer growth, grid modernization, storm hardening, and solar additions (e.g., SoBRA and SolarTogether®) expanding the rate base. A 2026–2029 base-rate plan is central, including a Solar & Battery Base Rate Adjustment in 2028–2029 to support additional solar and storage.
2) Renewables + Storage Scale at NEER. NEE continues to add long-term contracted capacity in wind, solar, and batteries. In 2024, NEER brought online ~1.4 GW wind, ~2.5 GW solar, and ~0.8 GW battery storage. The strategy emphasizes contracted PPAs, storage co-location, and portfolio optimization through selective JVs and asset sales.
3) Transmission Expansion via NEET. Rate-regulated transmission underpins stable returns and deepens the regulated mix. Projects across CAISO, SPP, ERCOT, and PJM are part of the expansion focus.
4) Capital Allocation Discipline. Management prioritizes strong investment-grade ratings, liquidity, and tax-credit monetization (transferability, differential membership interests) to fund an elevated capex cycle while containing equity needs.
Financial Performance (Historical & 3–5 Year Outlook)
Revenue. From 2020 to 2023, revenue scaled from $18.0 billion to $28.1 billion (+15% CAGR) on renewables commissioning and FPL rate-base growth. In 2024, revenue contracted to $24.8 billion (–12% YoY) on project timing and lower merchant pricing. Forecasts indicate a rebound in 2025 and a steadier path thereafter: FY25–27 CAGR of +9–10% as backlog converts, then a moderation to ~4–5% CAGR through FY33, with revenue projected to reach ~$49.9 billion by FY33. Mix progressively tilts toward regulated recovery, trending toward ~70% of revenue by FY30.
Margins & EBITDA. Gross profit rose from $10.5 billion (2020) to $17.9 billion (2023), easing to $14.9 billion in 2024. Looking forward, gross margin is expected to stabilize in the 65–68% range as regulated and transmission mix rises and solar LCOE declines. EBITDA expanded from $8.7 billion (2020) to $16.8 billion (2023) before dipping to $14.0 billion (2024). Forecasts point to mid-single-digit growth, with EBITDA reaching ~$31.0 billion by FY33 and margins >60% supported by rate base expansion and contracted renewables. (Where specific year-by-year figures are not disclosed, the source provides directional commentary and endpoints.)
Free Cash Flow, CAPEX, and Working Capital. Near-term FCFF remains constrained by heavy capex tied to grid and renewables buildout. Capex grew from $11.8 billion (2021) to $19.2 billion (2024) and is forecast to rise to ~$31.9 billion by FY33, with capex/sales peaking in the mid-to-high 80% range before normalizing to ~64% beyond FY30. Net working capital increased from $6.0 billion (2020) to $8.6 billion (2024) and is expected to track revenue growth with NWC/sales stabilizing at ~35–37%. Liquidity (~$18 billion available) and laddered investment-grade debt support the cycle.
Balance Sheet & Liquidity. PP&E stands at ~ $139 billion, and liquidity remains robust with undrawn facilities. The balance sheet’s principal sensitivities are derivative mark-to-market swings and rate/market conditions. Cash flow from operations at ≈$13.3 billion provides meaningful self-funding capacity alongside tax-credit monetization, though high capex implies continued external funding needs.
Valuation (DCF & Multiples)
DCF Base Case (source model). WACC: 7.6%; terminal growth: 2.0%. Enterprise value: $149.0 billion. Net debt: $111.2 billion. Equity value: $55.9 billion. Fair value per share ≈ $72.3. The analysis notes that terminal value accounts for ~140% of total PV—typical for a long-duration, capex-heavy utility where near-term FCFF is depressed.
Rate Sensitivity. A ±1.0% move in WACC shifts enterprise value by >$75–100 billion. Scenario framing:
- Bear: WACC 8.6%, g 1.5% → EV $92.5 billion, implied EV/EBITDA 5.5×; downside into the mid-$40s per share.
- Base: WACC 7.6%, g 2.0% → EV $149.0 billion, EV/EBITDA 8.8×; fair value ~$66–70/share when blended with market approach.
- Bull: WACC 6.6%, g 2.5% → EV $250.4 billion, EV/EBITDA 14.8×; upside >$100/share.
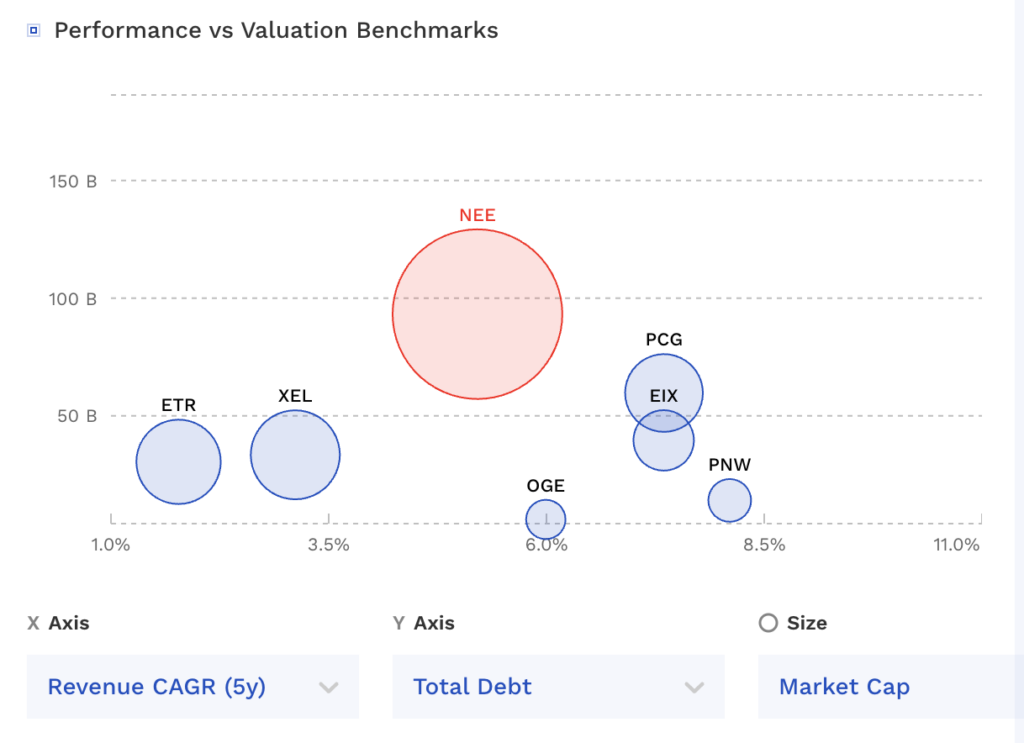
Multiples Cross-Check. Peer EV/EBITDA distribution centers around a 12.0× median (10.6× first quartile, 14.0× third quartile). Applying 12.0× to normalized 2025F EBITDA of ~$16.9 billion implies an enterprise value of ~$203.3 billion and a base-case equity value around $110.1 billion (range ~$86.4–144.0 billion). Notably, the source observes NEE trading closer to ~9× forward EV/EBITDA versus a sector median ~12×, suggesting market focus on near-term financing risk rather than structural fundamentals.
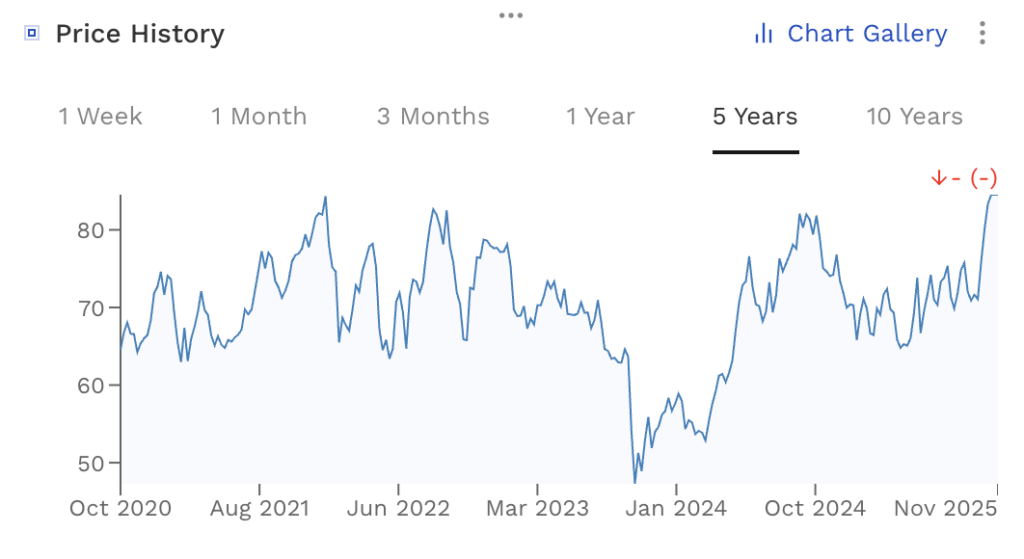
Blended Target. Combining DCF (70% weight) and market multiples (30%) yields a base 12-month target of $66.7 per share, which is ~21% below the referenced spot price (~$84.5).
Guardrails & Observations. With a DCF base value below price, valuation is rate-sensitive and execution-dependent. The model’s heavy terminal value weighting elevates sensitivity to WACC and terminal growth. Multiples imply wider outcomes, reflecting uncertainty around the pace of renewables conversion, rate case results, and tax-credit monetization cadence.
Opportunities vs. Risks
Opportunities
- Constructive Florida framework: A supportive 2026–2029 FPL base-rate settlement (allowed ROE near proposal, equity-layer continuity, Solar & Battery BRA approvals) could unlock incremental rate base growth.
- Backlog conversion at scale: Long-dated PPAs, storage attach rates, and selective JV structures sustain contracted cash flows and broaden optionality.
- Transmission awards: Expansion through NEET across CAISO/SPP/ERCOT/PJM increases regulated mix and cash-flow durability.
- IRA monetization: Efficient tax-credit sales/transferability bolster after-tax returns and reduce cash tax burden through the build cycle.
- Data center/industrial load: Emerging load in Florida and across interconnects supports additional capacity and potential upside to capex plans.
Risks
- Rates/WACC: Higher-for-longer yields pressure valuation; each ±50 bps in WACC is roughly ±5–6% to DCF per the source.
- Regulatory outcomes: FPSC decisions on allowed ROE/equity ratio and the scope/timing of recovery mechanisms.
- Execution/supply chain: Multi-GW build schedules, interconnection queues, and EPC cost variability.
- Weather/storms: Hurricane exposure elevates opex, capex, and recovery timing risk.
- Commodity/hedges: Non-qualifying hedge volatility and wholesale price dynamics affect reported results and comparability.
Investor Recommendations
Profile → Action → Rationale
- Long-term investor (3–5+ years) → Hold / Buy on weakness → Best-in-class dual platform with visible compounding, but duration/rate sensitivity caps near-term upside at current levels; add on dislocations in the $60–65 range (source base fair value corridor).
- Existing holders near target weights → Trim into strength → If shares re-rate toward the bull-case band ($95–$105) on falling rates/sector re-rating, harvest gains and rebalance given terminal-heavy DCF sensitivity.
- New buyers → Wait for a better entry → With a blended base target of $66.7, risk/reward improves on pullbacks tied to rates or regulatory headlines.
- Dividend-focused investors → Hold selectively → Dividend growth is underpinned by rate base expansion and contracted assets; funding needs during peak capex argue for entry discipline.
What to Watch
Execution KPIs
- FPL: Achieved vs. authorized ROE; base-rate filing milestones; approvals and MW additions under Solar & Battery BRA; storm-cost deferrals/recovery cadence; customer and usage growth.
- NEER: Annual MW added (wind/solar/storage), % contracted and PPA life; development backlog and cancellations; storage attach rates; volume/pricing of tax-credit monetization.
- NEET: Transmission pipeline milestone attainment (NTP/energization) across CAISO/SPP/ERCOT/PJM; evolving FERC ROE policy.
External Variables
- Rates and credit markets: UST 10Y trajectory and credit spreads directly influence WACC and equity duration.
- Regulatory calendars: FPSC proceedings for FPL; transmission-related rulemaking at FERC; state-level storm-hardening cost recovery.
- Permitting/interconnection: Federal land use for wind, queue backlogs, and upgrade cost allocation.
- Weather seasonality: Hurricane activity and restoration cost recovery timing.
Conclusion
NextEra Energy remains the sector benchmark for combining regulated stability with renewables leadership. The fundamentals are intact: liquidity (~$18 billion), durable cash generation (CFO ≈$13.3 billion), and a visible growth runway anchored by a $74.6 billion 2025–2029 capital plan. Margins and EBITDA quality are improving structurally as the mix tilts regulated and transmission-heavy, while renewables continue to convert backlog into contracted cash flow.
The challenge is valuation under a long-duration DCF framework. With WACC at 7.6% (base case) and terminal value comprising ~140% of PV, equity value is acutely rate-sensitive. The supplied model’s blended target of $66.7 per share (DCF 70% / market 30%) sits below the referenced spot (~$84.5), signaling limited near-term upside without a meaningful decline in rates or faster backlog conversion. Multiples analysis suggests a wide fair value range; however, the market is already discounting a better cost-of-capital regime than the DCF base case implies.
We reiterate a Hold / Trim stance. The long-term thesis—regulated compounding plus renewables scale—remains attractive, but entry discipline is prudent. For new capital, wait for pullbacks that align price with the $60–$70 base-case corridor. For existing holders, trim toward $95–$105 if a rate-led re-rating materializes, and recycle proceeds into dislocations or higher-conviction setups. Execution on rate cases, transmission, and tax-credit monetization will determine how quickly the equity closes the gap to the high end of the scenario range.
This article is for informational purposes only and is not investment advice.
NextEra Energy’s Valuation Report — Premium Download
Full 26-page Deep Dive Report — Strategy, risks, and valuation
DCF Model with Graphs & Sensitivity Tables — WACC, EBITDA margin, terminal value
Official 2024 Grab Annual Report (PDF) — So you can see what management said
Editable Excel File — All valuation assumptions, calculations, and peer comps included