
Company Overview & Industry Context
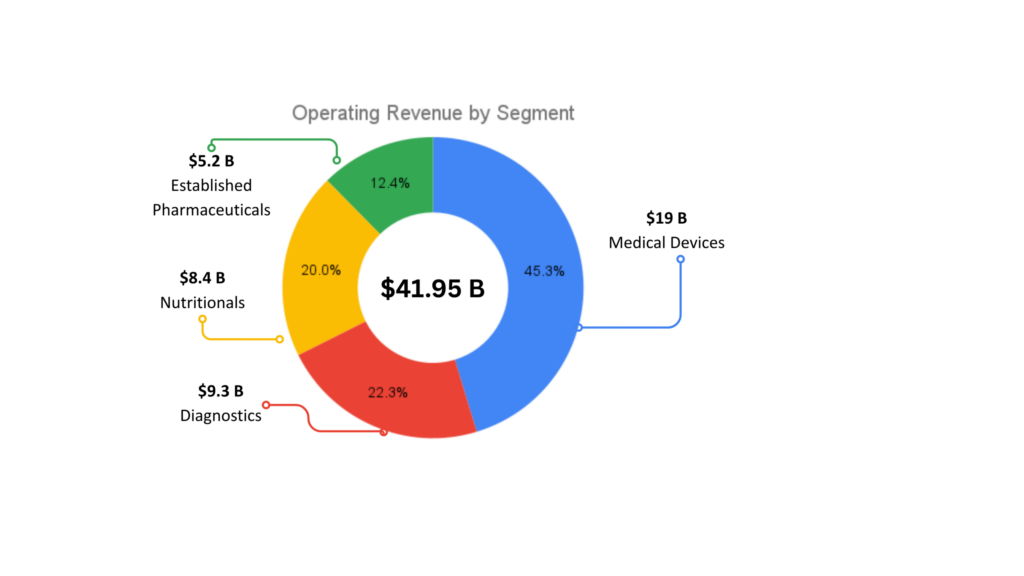
Abbott Laboratories (NYSE: ABT) stands as one of the most diversified healthcare companies globally, serving patients in over 160 countries with approximately 114,000 employees. Its four core business segments—Medical Devices, Diagnostics, Nutrition, and Established Pharmaceuticals—anchor a model that balances steady growth, recurring revenues, and resilient free cash flow.
In fiscal year 2024, Abbott reported total sales of $41.95 billion, up 4.6% year-over-year on a GAAP basis and 9.6% organically in its base business. Growth was supported by double-digit expansion in cardiovascular and diabetes care, steady recovery in nutrition, and stable performance in diagnostics after COVID normalization.
The company generated $6.8 billion in operating profit (≈16% margin) and $13.4 billion in net earnings, though that headline figure was inflated by a one-time tax benefit. Cash flow from operations reached $8.56 billion, underpinned by disciplined working capital management and ample liquidity, including $7.6 billion in cash and a new $5 billion revolving credit facility.
Abbott’s dividend aristocrat status remains intact: 53 consecutive years of dividend increases highlight its financial consistency. Since 2019, the company has returned over $25 billion to shareholders through dividends and buybacks, while maintaining an investment-grade balance sheet.
Strategic Focus
Abbott’s strategy is defined by four growth levers—innovation, access, digital transformation, and geographic diversification.
1. Innovation Leadership:
R&D investment totaled $2.8 billion in 2024, or ~7% of sales, supporting over 150 product approvals annually. Key platforms include:
- FreeStyle Libre, the leading continuous glucose monitoring (CGM) system with over 7 million global users.
- AVEIR DR, a dual-chamber leadless pacemaker.
- TriClip, a transcatheter valve repair device for structural heart therapy.
- Alinity diagnostic systems and AI-assisted cardiology tools like Ultreon 2.0.
2. Access and Affordability:
Abbott’s “Innovate for Access” initiative expands affordability across emerging markets, especially in nutrition and branded generics. Its Established Pharmaceuticals division remains focused on gastroenterology, cardiometabolic, and women’s health segments in high-growth geographies.
3. Digital Health & Ecosystem Expansion:
The company continues to build a digital ecosystem around its devices through NeuroSphere (connected neuromodulation therapy) and Lingo (a biosensor platform targeting wellness and metabolic health).
4. Sustainability and ESG:
Over $53 million was directed to humanitarian aid and health infrastructure projects in 2024. Abbott targets carbon reduction, circular manufacturing, and expanded access to diagnostics in underserved regions.
Financial Performance
Revenue Trajectory
Revenue has grown from $34.6 billion in 2020 to $41.9 billion in 2024, a five-year CAGR of ~5%. After pandemic-driven volatility, growth normalized in 2024 at +5%. The forward outlook projects a glide path of $44.7 billion in 2025 to $74.8 billion by 2033, implying a 7% CAGR (2025–2030) that tapers to 4% beyond 2030.
Profitability & Margins
Gross profit reached $23.3 billion in 2024, or 56% margin, up 100 basis points from the prior year. Forecasts call for margins rising toward 60% by 2033, driven by improved utilization and reduced logistics costs.
EBITDA stood at $10.4 billion (25% margin) in 2024, with forecasts rising to $22.4 billion (30%) by 2033. The key driver will be disciplined SG&A growth below revenue, supported by scale benefits in automation and supply chain optimization.
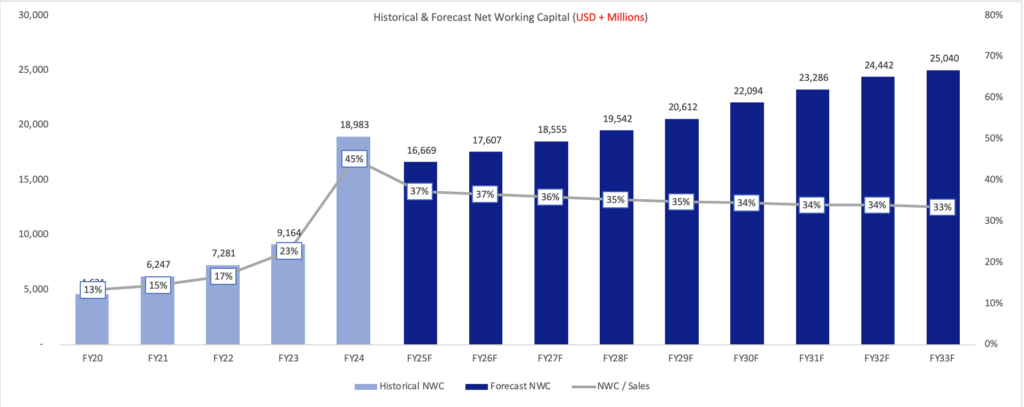
Cash Flow & Investment Discipline
Abbott’s free cash flow conversion remains strong. Net working capital efficiency (96-day cash conversion cycle) compares favorably with large-cap medtech peers. CAPEX normalized to $3.68 billion (9% of sales) in 2024, with plans to maintain 4–5% of sales through 2033, supporting a mid-teens free cash flow margin.
Financial Health
With manageable debt maturities and stable investment-grade ratings, Abbott maintains a conservative liquidity profile. The weighted average cost of capital (WACC) is 7.8%, below the medtech peer median (8.3–8.8%), reflecting low volatility and strong credit quality.
Valuation
DCF Summary
The discounted cash flow (DCF) model, using a 7.8% WACC and 3% terminal growth rate, yields an equity value of $225–230 billion, or approximately $127 per share. This aligns closely with Abbott’s current market capitalization of $219 billion, implying that shares trade near intrinsic value.
Key sensitivities:
- +0.5% in WACC → –$13–15 billion equity value.
- +0.5% in terminal growth → +$18–22 billion equity value.
About 70% of total DCF value stems from terminal cash flows, underscoring Abbott’s long-duration compounding profile.
Market Multiples Cross-Check
At ~15× EV/EBITDA, Abbott trades mid-range between growth peers (Stryker, Edwards Lifesciences) and defensive peers (BDX, Medtronic). On normalized 2024 EBITDA of $10.4 billion, implied enterprise value spans $121–258 billion, bracketing current levels.
Blended Target Price
Combining DCF (80% weight) and peer multiple (20%) yields a blended target price of $123.2/share, consistent with the current trading price ($123.6). The valuation framework supports a “fair value” stance—neither discounted nor overextended.
Opportunities vs. Risks
Key Opportunities
- CGM Expansion: Libre 3 Plus and Lingo biowearables could extend the platform beyond diabetes management.
- Cardiovascular Growth: New launches (TriClip, Volt PFA) target structural heart markets with high unmet need.
- Emerging Markets: Rising branded-generic penetration and pediatric nutrition recovery in Asia and Latin America.
- Operational Leverage: Margin lift from automation, AI-driven diagnostics, and procurement efficiency.
- Capital Returns: Continued dividend growth (+7% CAGR expected) and opportunistic buybacks (≈$2B/year).
Principal Risks
- Pricing Pressure: Reimbursement headwinds in the U.S. and Europe, especially in diabetes and cardiovascular segments.
- FX Exposure: 45% of revenue generated outside the U.S., with a 5% USD strengthening equating to a ~3% DCF impact.
- Competition: Heightened rivalry from Dexcom, Medtronic, Siemens Healthineers, and Nestlé Health Science.
- Regulatory/Tax Complexity: Ongoing scrutiny over unrecognized tax benefits and medical device approvals.
- Execution Risk: Delays in Libre or Structural Heart pipeline delivery could compress growth assumptions.
What to Watch
Operational KPIs:
- Organic sales growth ≥7–8%
- EBITDA margin ≥26%
- FreeStyle Libre users surpassing 8 million
- Gross margin expansion of +70 bps YoY
- R&D intensity ~6–7% of sales
External Variables:
- U.S. and EU reimbursement environment
- USD strength vs. euro/yen
- Regulatory progress for next-gen Libre and TriClip
- Inflation trajectory and interest-rate sensitivity (impacting WACC)
Conclusion
Abbott Laboratories exemplifies a “defensive compounder”: broad-based, innovation-driven, and financially disciplined. Its mix of medical devices, diagnostics, and nutrition ensures diversified, recurring revenues that support steady cash returns.
At roughly $124 per share, Abbott trades near its intrinsic DCF value (~$128), leaving limited multiple expansion potential in the near term. Upside hinges on margin execution in devices and continued Libre adoption, while downside protection is anchored by a strong balance sheet and dividend policy.
Fair Value News maintains a Core Hold rating—with accumulation warranted on dips below $115 and trimming above $140. For long-term portfolios seeking quality healthcare exposure and dividend reliability, Abbott remains a cornerstone name.
This article is for informational purposes only and is not investment advice.
Abbott’s Valuation Report — Premium Download
Full 26-page Deep Dive Report — Strategy, risks, and valuation
DCF Model with Graphs & Sensitivity Tables — WACC, EBITDA margin, terminal value
Official 2024 Grab Annual Report (PDF) — So you can see what management said
Editable Excel File — All valuation assumptions, calculations, and peer comps included